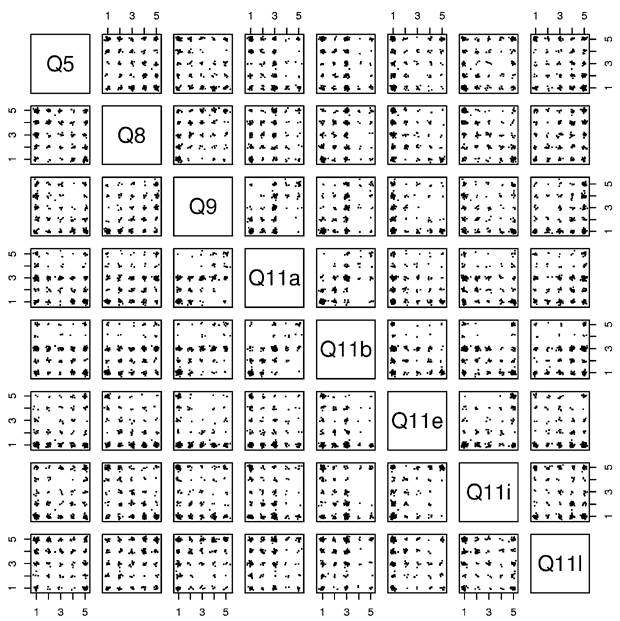
Results: GraphsFigure 1; Scatterplots of responses to several key questions. Note, for example, the positive relationship between responses to question 9 (acceptance of evolutionary theory as a complete and satisfying explanation of human origins) and responses to question Q11a which asks if a hypothetical reality to such an evolutionary explanation would be good for society.
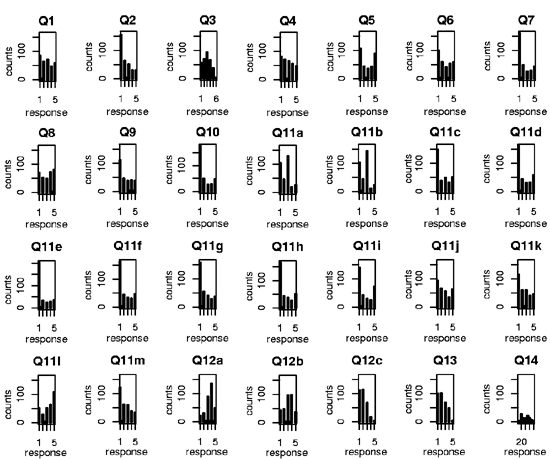
Figure 2. Counts of responses to various questions. Responses are not limited to integer values, but are limited to the range 1 to 5 when such a range is prescribed. Note the preponderance of extreme values for quite a few of the questions, such as questions 7 and 10 to which there was significant disagreement that naturalistic explanations of all historical events would be problematic for Christian theology and also disagreement that the Bible must be historically accurate (including Genesis 1) in order to be viewed as valuable and reliable.
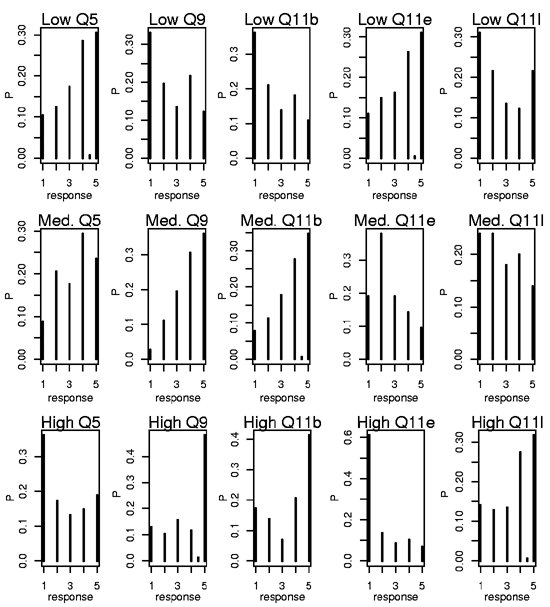
Figure 3. Conditional responses to question 8 (compatibility of evolutionary theory and Christian theology). A low response indicates a 1 or a 2; medium - a 3; high - a 4 or a 5. To illustrate how to interpret the graphs, consider the graph entitled High Q11e. This graph gives a probability density function for the responses to question 8 from the pool of people who gave a high response to question 11e. We see that conditional on a high response to question 11e (the dependence of biblical morality and ethics on the historical accuracy of the Biblical creation account), the probability of having a low belief in the compatibility of evolutionary theory and Christian theology is about three fourths (the sum of the values to responses of 1 and 2).
Email link | Printer-friendly | Feedback | Contributed by: David Caccia |


